![]()
Full QSDA2022 Practice Test and 78 Unique Questions, Get it Now!
The Best QSDA2022 Exam Study Material Premium Files and Preparation Tool
Qlik QSDA2022 Exam is a globally recognized certification that validates the candidate's expertise in Qlik Sense data architecture. Qlik Sense Data Architect Certification Exam - 2022 certification is highly valued by employers and can help data architects advance in their careers. It demonstrates the candidate's ability to design and develop complex data models, integrate data from various sources, and transform data into valuable insights using Qlik Sense. Qlik Sense Data Architect Certification Exam - 2022 certification also indicates the candidate's commitment to continuous learning and professional development. Passing the QSDA2022 Exam can open up new job opportunities and increase earning potential for data architects who work with Qlik Sense.
NEW QUESTION # 30
Refer to the exhibits.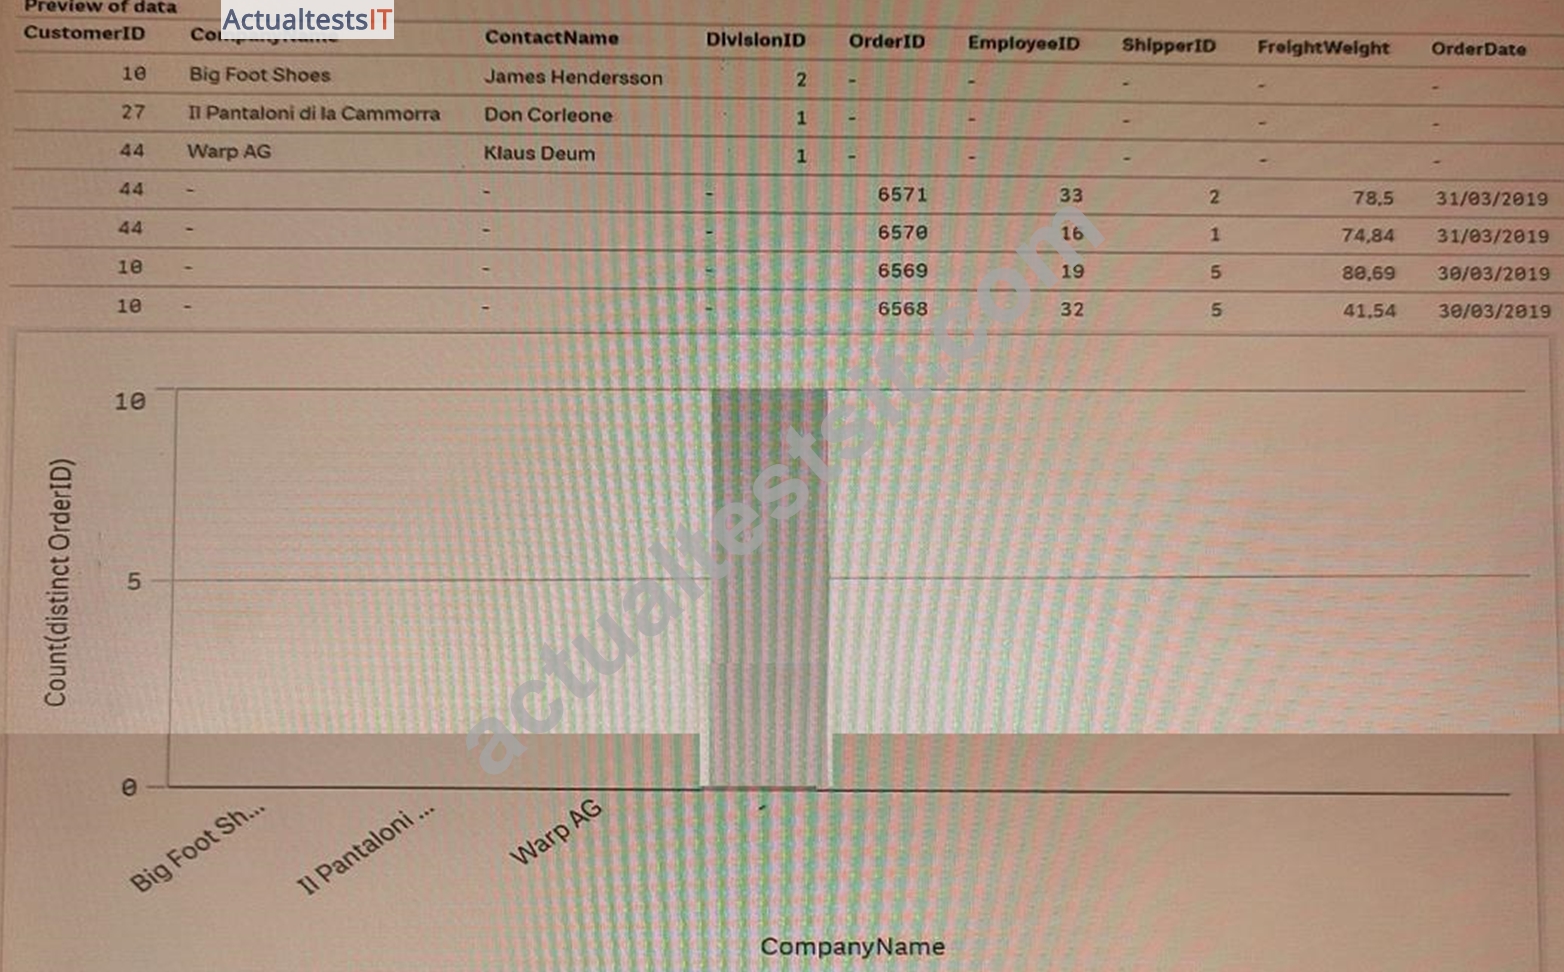
Some business users created an app by using the Add data functionality and loading two Excel files Orders and Customers.
The app is used to analyze the number of orders by customer. When the users create a bar chart to review the figures, the data shown is incorrect.
What should the data architect do to resolve this issue?
- A. Open the data manager, split the Customers table, and JOIN Orders and Customers on the CustomerlD field
- B. Open the data load editor and apply a NOCONCATENATE function in the LOAD statement on the Orders table
- C. Open the data load editor and use JOIN instead of concatenate to combine Orders and Customers by CustomerlD
- D. Open the data manager, split the Customers table, and associate both tables on CustomerlD field
Answer: C
NEW QUESTION # 31
A data architect needs to build an Order Fulfillment app. The business requires front-end performance is optimized.
The OrderDate and ShipmentDate are located in different tables.
The user needs to identify thedata type and must be able to:
* Show trends for orders and shipments
* Use a single filter for both date fields
* Analyze data over fiscal periods
Which steps should the data architect take to build the data model?
- A. 1. Create a master calendar table as a data island
2. Create a single filter using fields from the master calendar - B. 1. Create a link table with master calendar fields
2. Create a single filter using fields from the master calendar - C. 1. Create a master calendar andjoin into the Shipments and Orders table
2. Create a single filter using fields from the Shipments table - D. 1. Load the Shipments and Orders table via the data manager
2. Create a single filter using fields from the Orders table
Answer: B
NEW QUESTION # 32
A data architect completes development of a new app with two data sources Both data sources will also be used by other apps in the future The sources have different data refresh frequencies
* Source 1 Contains frequently updated data and must be refreshed hourly
* Source 2 Contains data that is transferred from a partner and must be refreshed weekly Tasks must be created to load the data sources and make sure that the new app uses the most current data The data will be stored in two QVDs Which tasks should be created to meet these requirements'?
- A. 1 Schedule Task 1 to run hourly and refresh data from Source 1
2 Schedule Task 2 to run weekly and refresh data from Source 2
3. Schedule a task for the app that is dependent on completion of Tasks 1 or 2 that loads the two QVDs - B. 1. Schedule Task 1 to run hourly and refresh data from Source 1
2 Schedule Task 2 that is dependent on Task 1 to refresh data from Source 2
3. Schedule a task for the app that is dependent on completion of Task 2 that loads the two QVDs - C. 1. Schedule Task 1 to run hourly and refresh data from Source 1
2 Schedule Task 2 that is dependent on Task 1 to refresh data from Source 2
3 Schedule a task for the app that is dependent on completion of Tasks 1 and 2 that loads the two QVDs - D. 1 Schedule Task 1 to run hourly and refresh data from Source 1
2 Schedule Task 2 to run weekly and refresh data from Source 2
3. Schedule a task for the app that is dependent on completion of Task 2 that loads the two QVDs
Answer: C
Explanation:
Explanation
This option ensures that the data in the two data sources is always up-to-date by scheduling the data refresh tasks to run at the appropriate frequencies. Task 1 runs hourly to refresh data from Source 1, and Task 2 is dependent on Task 1 so that it runs only after Task 1 is completed. This ensures that the data from Source 2 is loaded only after the most current data from Source 1 is loaded.
NEW QUESTION # 33
Refer to the exhibit.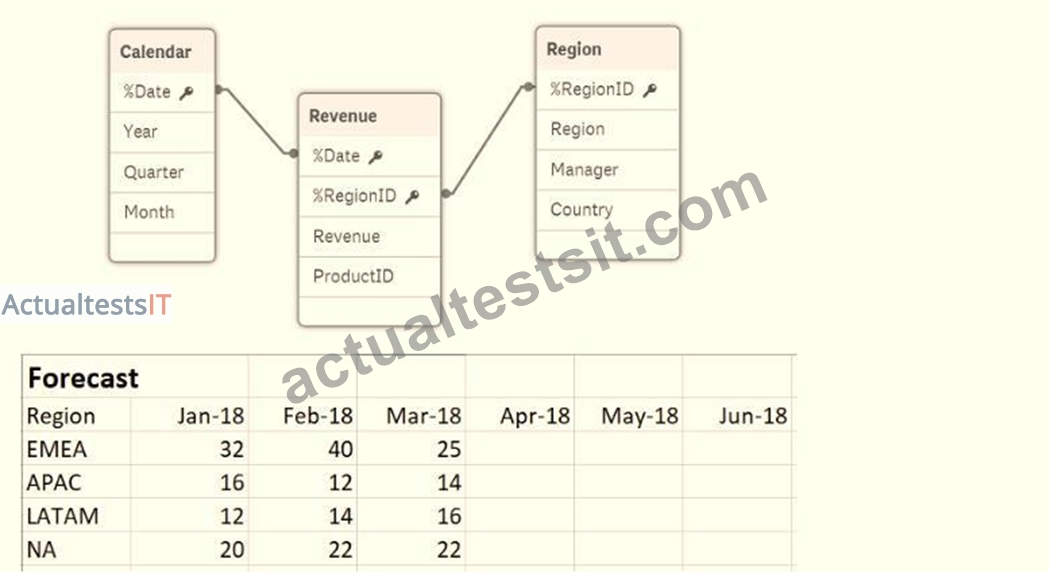
A business department is forecasting revenue within an Excel spreadsheet.
A data architect needs to include this forecast into the existing data model, and without losing any data.
Which two sets of steps will meet these requirements? (Select two.)
- A. 1 Load the Excel spreadsheet into the data manager
2. Use the Unpivot function
3. Create a composite key from the date and region
4. Connect the new table to the data model
1 Load the Excel spreadsheet using the data manager
2 Rename the ForecastDate field to Date 3. Disable the Region
4 Connect to the existing data model - B. 1. Load the Excel spreadsheet using the data load editor
2. Use the Unpivot function
3 Use the Sum function to group the forecast by date
4 Connect to the existing data model - C. 1. Load the Excel spreadsheet using the data load editor
2 Use the Crosstable function to unpivot the table
3 Create a composite key out of the date and region
4 Connect the new table to the data model - D. 1 Load the Excel spreadsheet using the data load editor
2. Change the sort order by date
3. Create a composite key out of the forecast and region 4 Connect to the existing data model
Answer: A,C
Explanation:
Explanation
Option B involves loading the Excel spreadsheet using the data load editor and then using the Crosstable function to unpivot the table, creating a composite key out of the date and region, and connecting the new table to the existing data model. Option D involves loading the Excel spreadsheet using the data manager, using the Unpivot function, creating a composite key from the date and region, and connecting the new table to the existing data model.
NEW QUESTION # 34
A global retailer has a large database in which millions of sales transactions are added per hour.
Each regional sales manager should only see details for customers in their region. After filtering based on criteria such as region, gender,and income level, sales managers should be able to see the most current detailed transactions.
What should a data architect do to meet these requirements?
- A. Use section access to restrict sales manager access by region
- B. Use section access and include aservice account in the table
- C. Create an app for each sales manager with Qlik GeoAnalytics
- D. Use On-Demand App Generation (ODAG) and section access
Answer: A
NEW QUESTION # 35
Refer to the exhibit.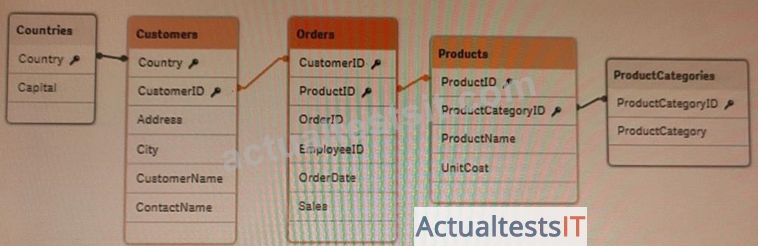
A data architect needs to add a Budget table to the current Qlik Sense app. A Budget table with the fields Budget, CustomerlD, and ProductlD is loaded into the model. What will be created?
- A. A synthetic table with two synthetic keys
- B. A circular reference with one table disconnected
- C. A synthetic table with three synthetic keys
- D. A synthetic table and one synthetic key
Answer: B
NEW QUESTION # 36 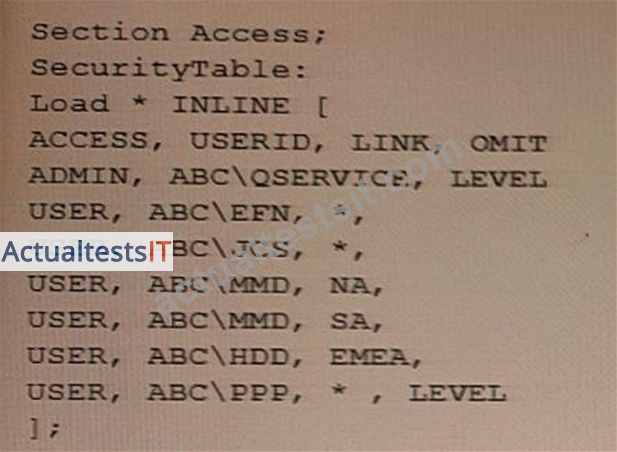
The Section Access security table for an app is shown. User ABC\PPP opens a Qlik Sense app with a table using the field called LEVEL on one of the table columns.
What is the result?
- A. The table is displayed without the LEVELcolumn.
- B. The table is removed from the user interface.
- C. The user gets a "Field not found" error.
- D. The user gets an "incomplete visualization" error
Answer: D
NEW QUESTION # 37
A data architect needs to write theexpression for a measure on a KPI to show the sales person with the highest sales The sort order of the values of the fields is unknown When two or more sales people have sold the same amount, the expression should return all of those sales people Which expression should the data architect use?
- A. FirstSortedValue (DISTINCT Salesperson, -Aggr (Sum(Sales) , Salesperson) )
- B. Concat(DISTINCT IF (Aggr (Rank (Sum (Sales) , 4) , Salesperson) =1, Salesperson) , ' ')
- C. Concat (DISTINCT IF (Aggr (Rank (Sum (Sales) , 1) , Salesperson) =1, Salesperson) , ' ')
- D. FirstSortedValue (Salesperson, -Aggr (Sum(Sales) , Salesperson) )
Answer: C
NEW QUESTION # 38
Refer to the exhibit.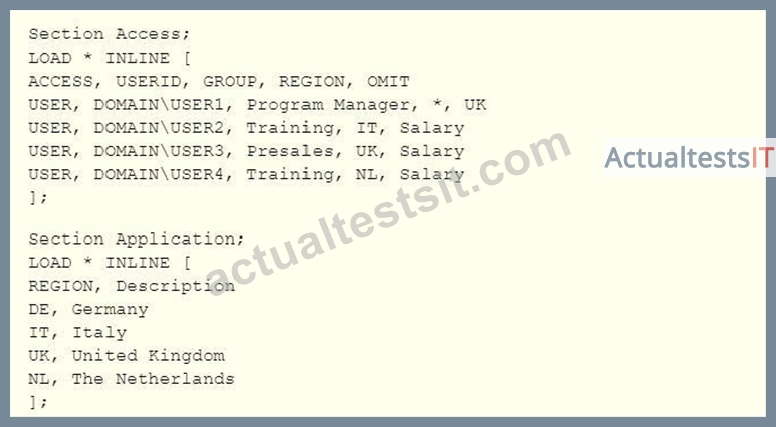
USER1 has an app protected using this Section Access statement.
Which countries can USER1 see in the app''
- A. Italy, The Netherlands
- B. Germany. Italy, United Kingdom, The Netherlands
- C. Germany Italy, The Netherlands
- D. Italy, United Kingdom, The Netherlands
Answer: D
NEW QUESTION # 39
Multiple department fields in a dataset require a description
A data architect needs to add the department descriptions or a default value when the department does NOT have a description Which strategy should the data architect use to meet these requirements?
- A. ApplyMap with two parameters after the Mapping load
- B. Enter "Missing description" in the blank rows for Description xlsx then Mapping Load
- C. Left Join between tables and Description xlsx in every Department table
- D. ApplyMap with three parameters after the Mapping load
Answer: D
Explanation:
Explanation
This strategy involves using the ApplyMap function with threeparameters after the Mapping load. This will allow the data architect to add the department descriptions or a default value when the department does not have a description.Source: Qlik
NEW QUESTION # 40
A data architect needs to revise an existing app.
The number of data rows has grown rapidly recently. While the app is in production, users are becoming increasingly unhappy about the response times when they make selections Which two methods should be used toimprove performance? (Select two.)
- A. Use flags in the data model to simplify set analysis
- B. Denormalize the schema
- C. Create master items for all complex expressions
- D. Use dynamic script generation with variables
- E. Make sure any Ul variables are preceded by '='
Answer: A,D
NEW QUESTION # 41
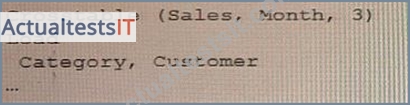
Refer to the exhibit.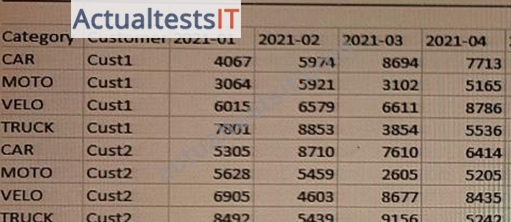
A customer needs to load forecast data from an Excel file.
Which preceding load statement should the data architect use to load the data?
- A.
- B.

- C.

- D.

Answer: C
NEW QUESTION # 42
Refer to the exhibit.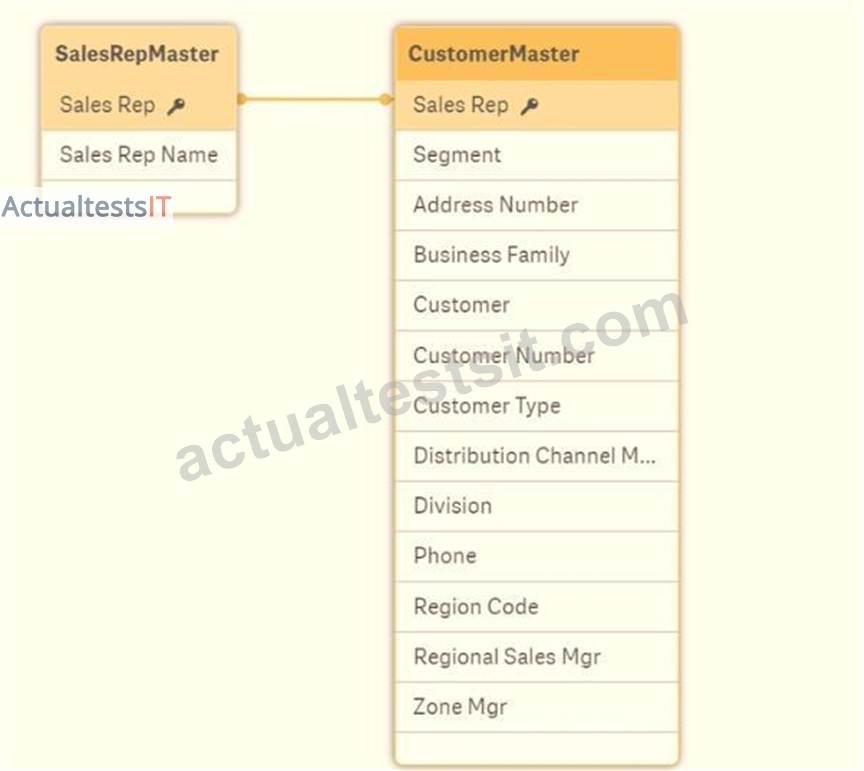
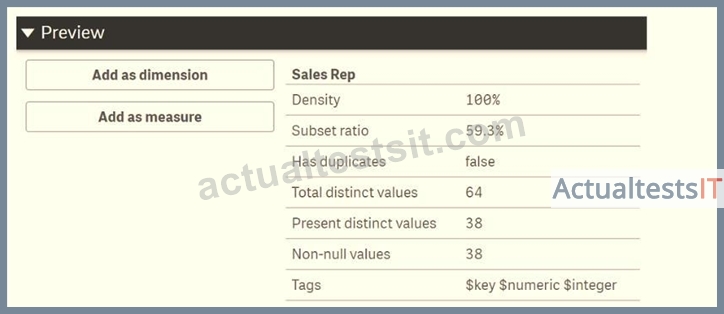
Refer to the exhibits.
While using an app, the users report that some Sales Reps do NOT have personal details, like Division or Address Number A data architect has been called in to investigate.
The data architect uses the data model viewer to determine the relationship between the SalesRepMaster and CustomerMaster tables.
What is the cause of the issue?
- A. 26 values for Sales Rep are null in CustomerMaster
- B. Density is 100% while Total Distinct and Present Distinct are NOT the same
- C. 40.7% of the Sales Rep have CustomerMaster information
- D. 59.3% of the Sales Rep have CustomerMaster information
Answer: B
Explanation:
Explanation
When using the data model viewer to investigate the relationship between the SalesRepMaster and CustomerMaster tables, the data architect would look at the density of the relationship. Density is a measure of how well the key fields of a table match the key fields of another table. A density of 100% means that all key fields in one table have a match in the other table.
When the density is 100% but the total distinct and present distinct values for the key fields of the related tables do not match, it means that some of the key fields in one table do not have a match in the other table, this is the cause of the issue.
NEW QUESTION # 43 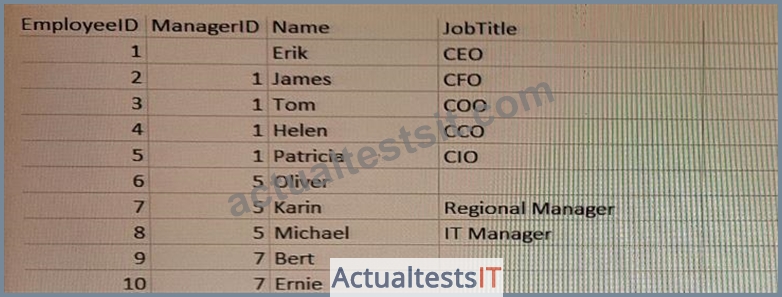
A Human Resources Director needs an app to analyze organizational structure. The Directory is particularly interested in the longest levels of line management.
Two table loads are required. Both use the same basic structure.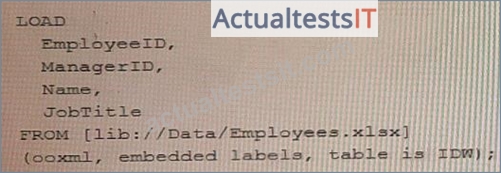
Which two table load prefixes are needed?
- A. * Hierarchy(EmployeelD. ManagerlD Name, Manager Name, Structure V,Depth)
* HierarchyLevelEmployeelD, ManagerlD, Name, Manager, Name, Structure, Depth '/') - B. * HierarchyBelongs.To(EmployeeID, ManagerlD, Name ManagerlD, Manager, Depth)
- C. *HierarchyLevel(EmployeelD, ManagerlD Name Level, '/', Structure)
*HierarchyBelongsTo(EmployeelD, ManagerlD, Name ManagerlD,Manager, Depth) - D. * HierarchyBelongsTo(ManagerlD, Manager, ManagerlD, ManagerlD, Manager Level)
* Hierarchy(EmployeelD, ManagerlD, Name. Manager Name, Structure '/' Depth)
Answer: B
NEW QUESTION # 44
A data architect builds a data model for a large user group. Some sheets will be published, and the app will allow users to create their own visualizations and analyze data. Some fields must NOT appear in any field list.
How should a data architect meet these requirements?
- A. Use security rules
- B. Use HideField variable
- C. Add fields to master items
- D. Use HidePrefix variable
Answer: A
Explanation:
Explanation
The best way for a data architect to meet the requirements of not allowing some fields to appear in any field list is to use security rules. Security rules can be used to restrict access to certain fields, which will ensure that they don't appear in any field list or visualization. Additionally, security rules can also be used to restrict access to certain data models, ensuring that only users with the right permissions can view and analyze the data.
Row-level security (RLS) with Power BI - Power BI | Microsoft Learn
https://learn.microsoft.com/en-us/power-bi/enterprise/service-admin-rls What Is Data Visualization? Definition & Examples | Tableau
https://www.tableau.com/learn/articles/data-visualization
80+ Top Power BI Interview Questions and Answers [Updated 2023]
https://www.edureka.co/blog/interview-questions/power-bi-interview-questions/
NEW QUESTION # 45
A data architect is using an Include statement to load the collection of variables from a TextFiles folder connection into an app. The data architect needs to load the data and generate an error if it fails.
Which statement should the data architect use?
- A. $(Must_Include=lib://TextFiles/Variables.txt);
- B. (Includs=lib://TextFiles/Variables.txt);
- C. (Must_Include=lib://TextFiies/Variables.txt);
- D. $<Include=lib://TextFiles/Variables.txt);
Answer: A
Explanation:
Explanation
The MustInclude statement provides an error if the include fails and is used when including files in Qlik Sense.
The other statements do not provide an error if the include fails.
qlik-sense-certification-exam-study-guide-en.pdf
https://www.qlik.com/us/-/media/files/training/global-us/qlik-sense-certification-exam-study-guide-en.pdf?la=en Talk to Experts Tuesday - Migrating from QlikView to Qlik Sense FAQ
https://community.qlik.com/t5/Support-Knowledge-Base/Talk-to-Experts-Tuesday-Migrating-from-QlikView-to Certifications & Qualifications | Qlik
https://www.qlik.com/us/services/training/certifications-and-qualifications The $(Must_Include) statement is used to load a file or a set of files and generate an error if the load fails. The
"Must_Include" function will stop the script execution if the file is not found or cannot be loaded. The correct syntax for using the "Must_Include" statement is $(Must_Include=lib://TextFiles/Variables.txt);
NEW QUESTION # 46
A data architect needs to create an app that combines employee data from the Sales system and the Human Resources (HR) system.
These systems identify employees differently Employees in the HR system are identified with an alpha-numeric key Employees in the Sales system are identified using an integer key.
The Human Resources manager creates a table that maps these keys to another, called Associations.
The resultant data model must meet the following requirements:
* Associations must be valid
* The model must be optimized for performance
* The option must support multiple tables added
Which solution should the data architect use to meet these requirements?
- A. MAPSUBSTRING ( 'Associations' ,EMployeekey) As Employeekey;
- B. RENAME FIELDS USING Associations;
- C. MAP EmloyeeKey USING Associations;
- D. APPLYMAP ( 'Associations , EmployeeKey ) as Employeekey;
Answer: C
Explanation:
Explanation
The MAP function maps the EmployeeKey in the Sales system to the EmployeeKey in the HR system using the Associations table. This allows the data architect to join the data from the Sales system and the HR system using the same key, ensuring that the associations are valid.
Using the MAP function also optimizes the performance of the data model as it eliminates the need for multiple joins between the data from the Sales and HR systems.
This solution also supports multiple tables added, as the MAP function can be applied to any table that needs to be joined with the HR system data.
NEW QUESTION # 47
A data architect executes the following script: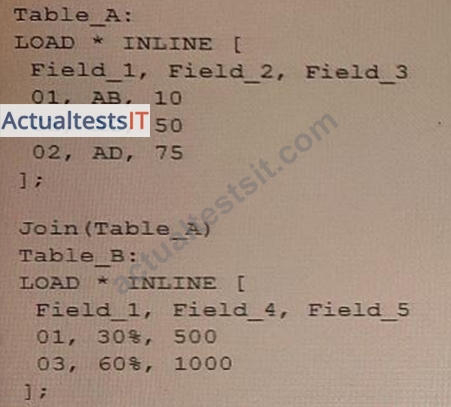
Whatwill be the result of Table A?
A)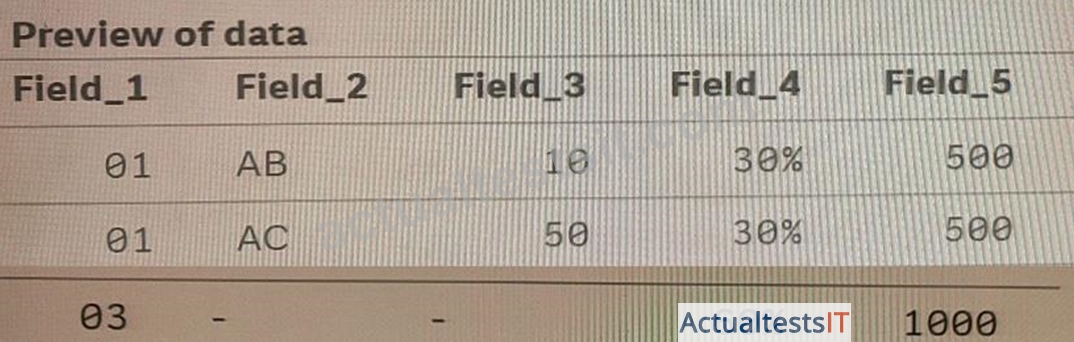
B)
C)
D)
- A. Option B
- B. Option A
- C. Option C
- D. Option D
Answer: D
NEW QUESTION # 48
......
Get Instant Access to QSDA2022 Practice Exam Questions: https://www.actualtestsit.com/Qlik/QSDA2022-exam-prep-dumps.html
Reliable Study Materials & Testing Engine for QSDA2022 Exam Success!: https://drive.google.com/open?id=1uNZvSUuar8CFP4pu3cr0rlIh6HUbYHw_